High-resolution DNA melting analysis of small amplicons is a simple and inexpensive technique for genotyping. Amplicon size, melting rate and analysis methods determine the sensitivity and specificity of small amplicon genotyping. Two publications concluded that with optimal temperature control
faster rates improve melting analysis, just like faster rates improve PCR.
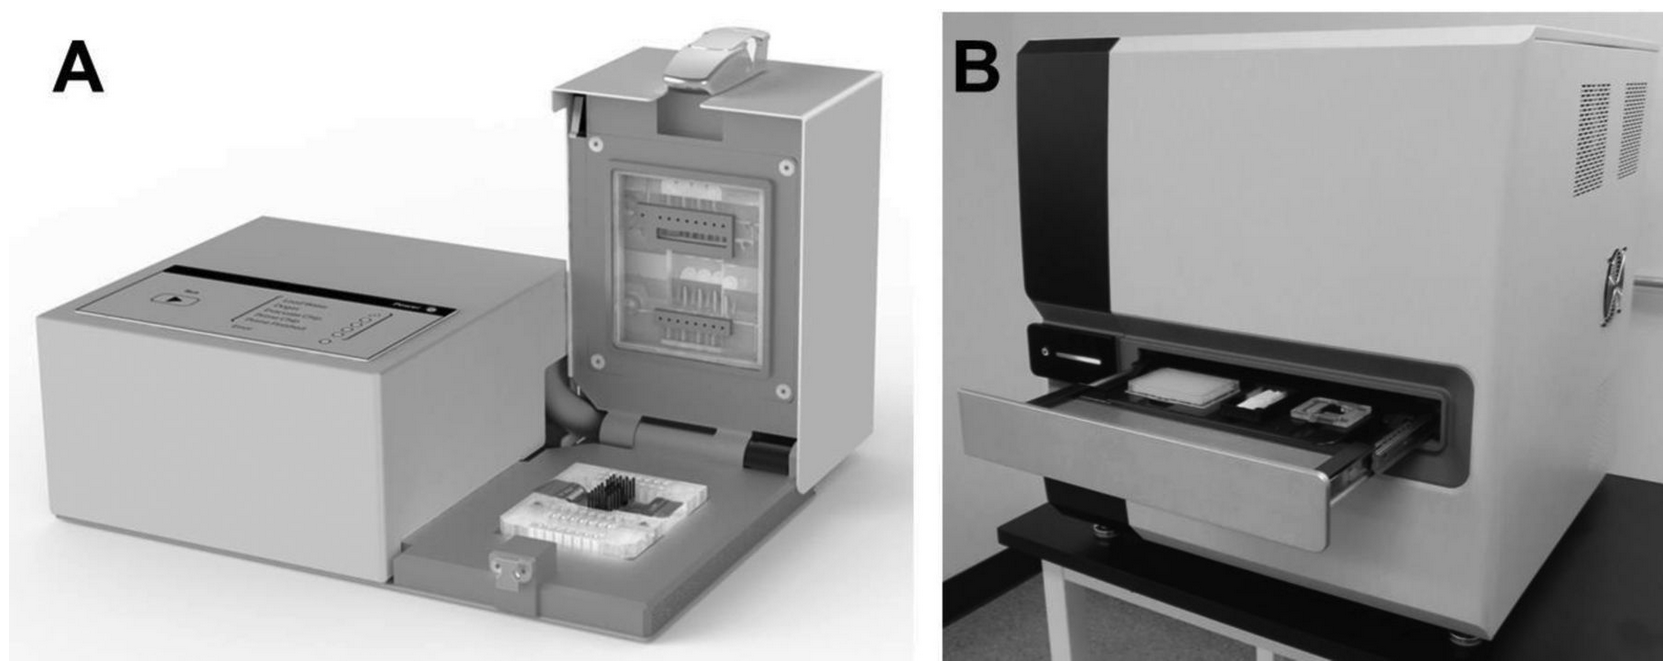
Microfluidics allows precise and rapid control of temperature during melting. The resulting technique,
High-Speed Melting Analysis
(Pryor
et al. Published in Clinical Chemistry), demonstrates high-speed melting reduces the time for melting analysis, decreases errors, and improves genotype discrimination of small amplicons. Combined with
Extreme PCR, high-speed melting promises nucleic acid amplification and genotyping in < 1 min.
High-Speed Melting can also be accomplished without microfluidics as described in Li.
et al.
(
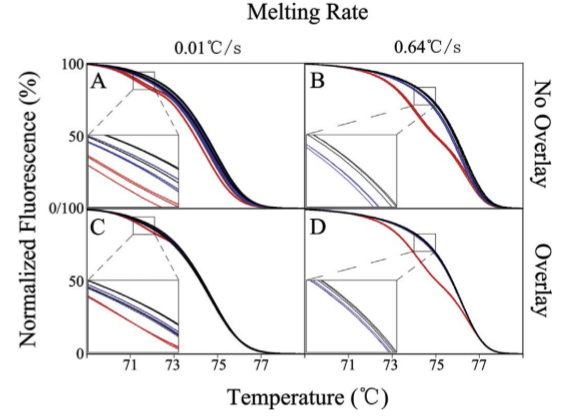
Published in Analytical Biochemistry). Faster speeds improve the separation of homozygote and heterozygote (shown below), leading to easier identification (both qualitatively and quantitatively).
Figure: Genotype discrimination at slow (A and C) and fast (B and D) melting rates, either
with (C and D) or without (A and B) curve overlay during analysis.(
Li et al.)
Using a microfluidic platform (
Pryor et al.) for serial PCR and melting analysis, 4 targets containing single nucleotide variants were amplified and then melted at different rates over a 250-fold range from 0.13 to 32 ℃/s. Genotypes (n = 1728) were determined manually by visual inspection after background removal, normalization, and conversion to negative derivative plots. Differences between genotypes were quantified by a genotype discrimination ratio on the basis of inter- and intragenotype differences using the absolute value of the maximum vertical difference between curves as a metric.
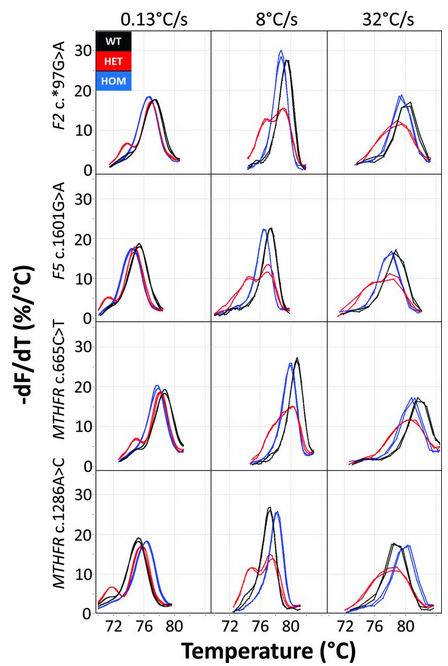
Figure: Example melting curves of 4 SNV loci studied at slow (0.13 ℃/s), fast (8 ℃/s), and very fast (32 ℃/s) melting rates. (
Pryor et al.)
The normalized negative derivative melting curves are displayed at 3 melting rates after background removal, normalization, and temperature adjustment to an internal temperature control (internal control not shown). Each panel includes duplicates of the 3 genotypes with wild-type (black), homozygous variant (blue), and the heterozygote (red). Small heteroduplex peaks at 0.13 ℃/s become larger and similar in height to the homoduplex peaks at 8 ℃/s, whereas the homozygous peaks become taller and narrower. At 32 ℃/s, heterozygous duplex peaks merge into a single broad peak as data acquisition rates limit homozygous peak sharpness, but all genotypes remain easily distinguishable.
In
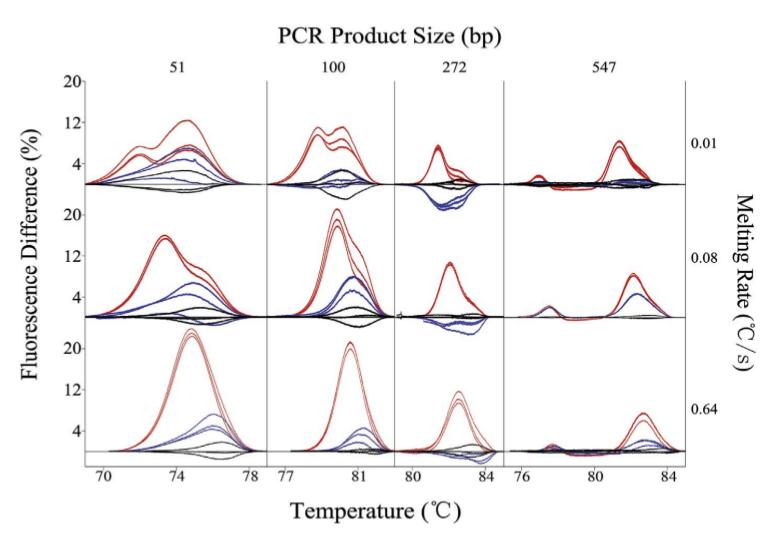
Li et al. , the effects of amplicon size (51-547 bp), melting rate (0.01-0.64 ℃/s) and analysis method (curve shape by overlay vs absolute temperature differences) were qualitatively and quantitatively analyzed. We studied a single nucleotide variant with identical predicted wild type and homozygous variant stabilities by nearest neighbor thermodynamic theory.
Figure: Genotype difference plots of 51, 100, 272, and 547
bp PCR products at low (0.01 ℃/s), moderate (0.08 ℃/s)
and high (0.64 ℃/s) melting rates. (
Li et al.)
Different homozygous curves were genotyped by melting temperature and heterozygous curves were identified by shape on a microfluidic system (
Pryor et al.). Technical artifacts preventing analysis (0.3%), incorrect (0.06%), and indeterminate (0.4%) results were minimal, occurring mostly at slow melting rates (0.13-0.5 ℃/s). Genotype discrimination was maximal at around 8 ℃/s (2-8 ℃/s for homozygotes and 8-16 ℃/s for heterozygotes), and no genotyping errors were made at rates>0.5 ℃/s. PCR was completed in 10-12.2 min, followed by melting curve acquisition in 4 min down to <1 s.
Figure: The effect of melting rate on PCR product melting curves containing a single nucleotide variant. (
Pryor et al.)
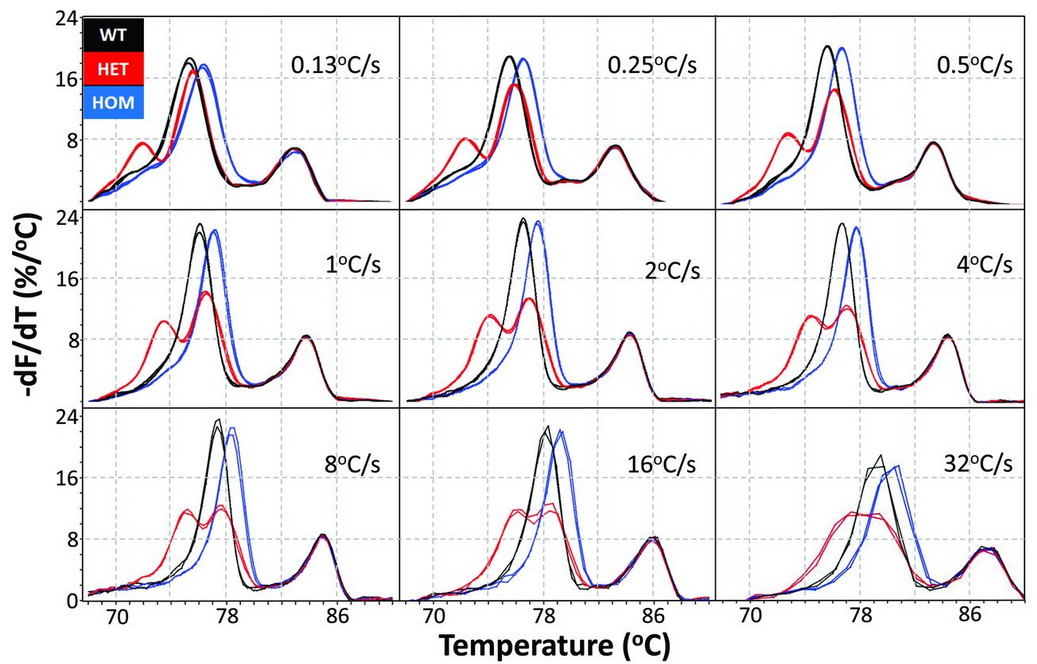
A 46 bp PCR product encompassing the MTHFR c.1286A>C locus was amplified and repeatedly melted at different rates along with an internal temperature control. Melting data were processed by exponential background removal, normalization, and linear temperature adjustment to the internal temperature control to compensate for any temperature variation between channels. Negative derivative plots at each melting rate show 2 wild-type (WT) samples as black lines, 2 homozygous (HOM) variants as blue lines, and 2 heterozygotes (HET) as red lines. The PCR product melted at 70-83 ℃, whereas the internal temperature control melted at higher temperatures, around 83-87 ℃. The apparent melting temperatures increased with increasing melting rate. The duplicate genotypes cluster distinctly, and the lower temperature heteroduplex peaks of the heterozygotes become more pronounced as the melting rate increases. At 32 ℃/s, heteroduplex and homoduplex peaks merge into a single, broad peak because of low data density. Nevertheless, genotyping is clearly possible at all rates.
Figure: Melting-rate dependence of genotype discrimination. (
Pryor et al.)
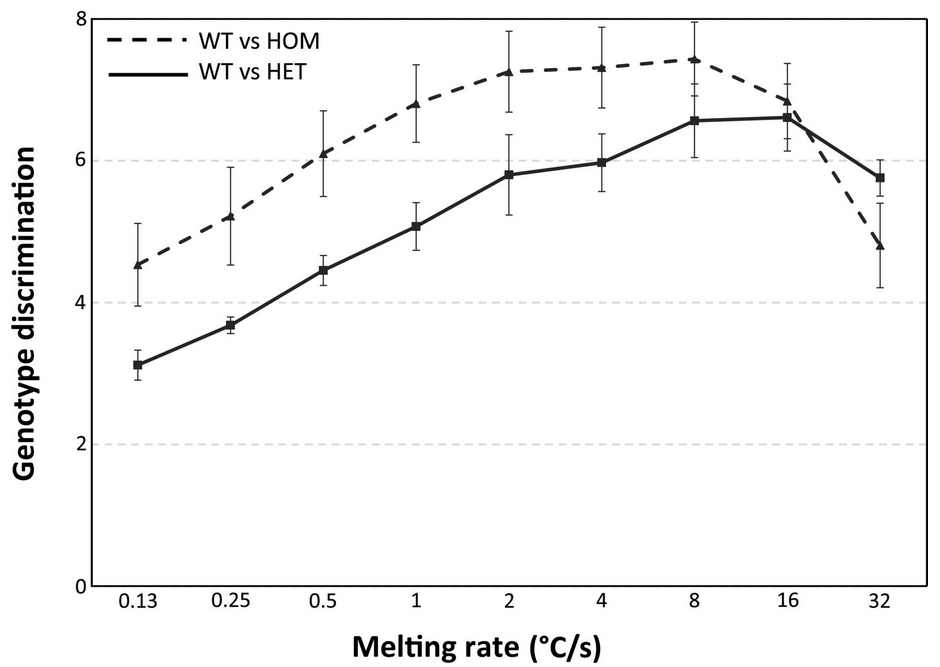
Genotype discrimination ratios of interclass to intraclass differences were used to quantify the ease of distinguishing between genotypes. Wild-type vs homozygote (dashed line) and wild-type vs heterozygote (solid line) are shown. Each point in the figure displays the mean (dimensionless) discrimination ratio obtained from 2 users analyzing all 4 loci in 8 cartridge runs for each melting rate. All 4 genotyping loci are included to best display the effect of melting rate across loci, although absolute differences across the loci do increase the variance (error bars show the standard error of the mean). Using a one-tailed t-test and assuming unequal variance, genotyping discrimination between 0.13 ℃/s and 8 ℃/s is significantly different for homozygotes (P = 0.005) and heterozygotes (P = 0.0004). When individual loci are analyzed, the variance is less and significant differences are greater, but the trend is less clear (data not shown). The best discrimination of homozygotes occurs at rates of 2-8 ℃/s, whereas heterozygotes are best discriminated at 8-16 ℃/s.
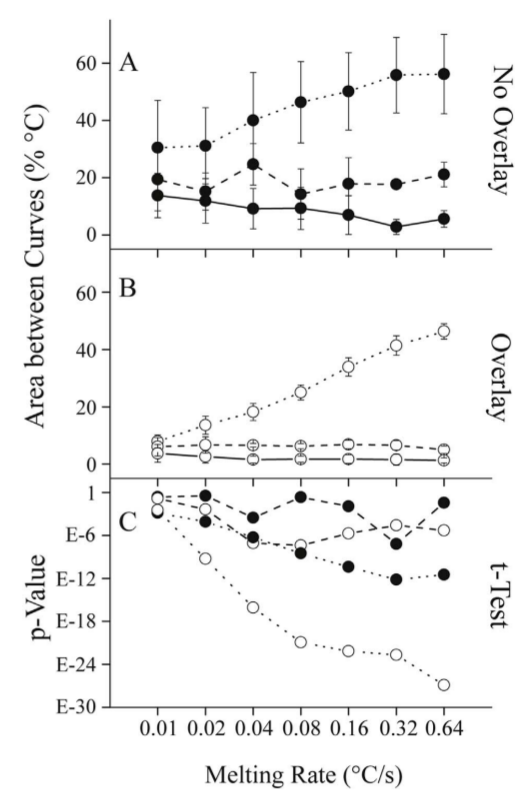
Figure: The area between curves within and between genotypes at different melting rates
for a 51 bp product.(
Li et al.)
Panel A shows the mean +/- SD of the areas between all pairwise
comparisons that are intraclass (AA vs AA, TT vs TT, and AT vs AT, solid lines), homozygous interclass (AA vs TT, dashes) and heterozygous interclass (AT vs AA or TT, dots)
when overlay is not performed. Panel B shows the same comparisons after overlay. Panel
C provides p-values for mean genotype differences, specifically for the homozygote (AA vs
TT, dashes) and heterozygote (AT vs AA or TT, dots), either with (open circles) or without
(solid circles) overlay.
In both publications, the authors concluded that heterozygote identification improved with faster rates.
Li et al. developed a method to quantify melting curve differences which includes the area between curves. Using quantitative metrics, the publication summarizes the improved discrimination due to faster rates and analytical curve overlay.
Pryor et al. concluded that microfluidics enables genotyping by melting analysis at rates up to 32 ℃/s, requiring <1 s to acquire an entire melting curve. High-speed melting
reduces the time for melting analysis,
decreases errors, and
improves genotype discrimination of small amplicons. Combined with Extreme PCR, high-speed melting promises nucleic acid amplification and genotyping in < 1 minute.
